ETFs – a Total Cost of Ownership (TCO) Primer

Exchange Traded Funds (ETFs) is emerging as a highly competitive market in the financial world. With similar expense ratios among competing ETFs, other cost-related factors have become increasingly important when selecting an indexed ETF. Therefore, it is crucial to compare ETFs based on the total cost of ownership (TCO) rather than solely on the expense ratio.

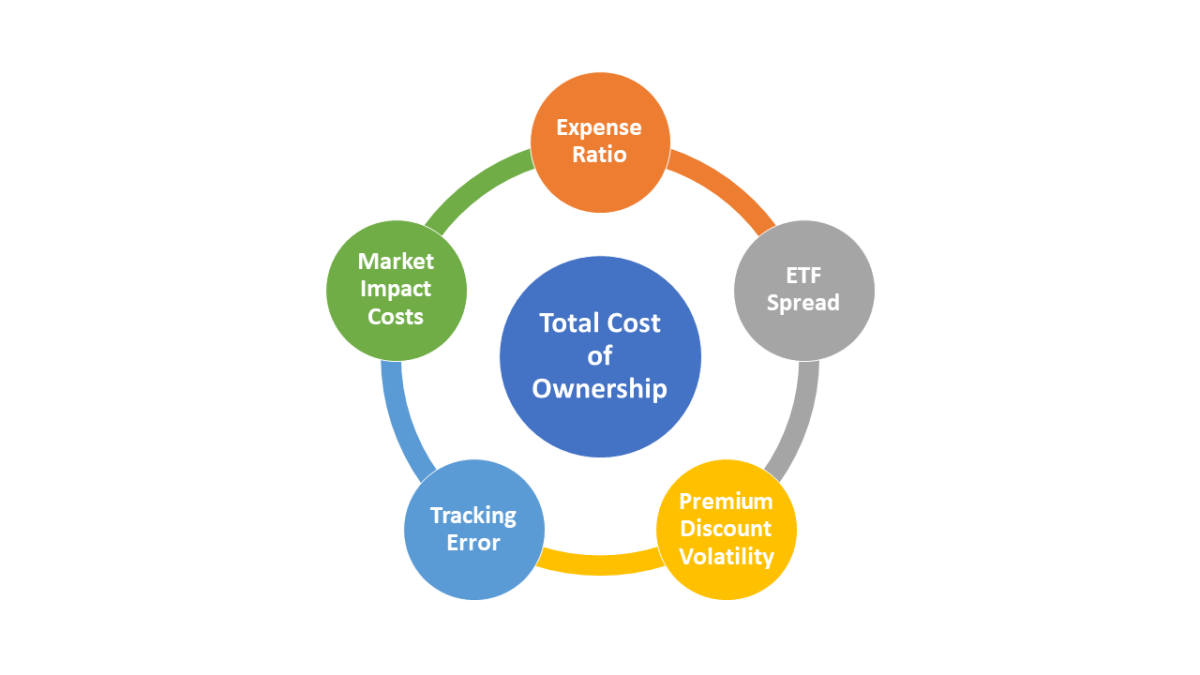
The TCO of an ETF includes direct fund expenses (expense ratio), trading costs (brokerage, bid/ask spread, and premium/discount volatility), tracking mismatch between the ETF and its benchmark, and market impact costs. Understanding the relative importance of these factors is crucial, depending on the investment’s time horizon and the size of the trade that an investor wishes to make.

Expense Ratio
The Expense Ratio is the annual rate that the fund charges on the total assets it holds to pay for portfolio management, administration, and other costs. ETFs typically calculate the annual expense ratio by dividing the fund’s operational expenses by its average net assets. As an ongoing expense, the expense ratio is relevant for all investors but particularly for long-term, buy-and-hold investors.

Brokerage Costs
As ETFs are purchased and sold on the stock markets, the intermediary in this case, the stockbroker, will charge “Brokerage fee” which could be a flat fee or a percentage of the value of the trade. So, the more frequently you trade, the more you will pay in total brokerage charges. If the brokerage is a flat fee no matter how large or small the trade, the percentage cost per trade will be larger for smaller trades and smaller for larger trades.

Bid/ Ask Spread
Bid/ Ask Spread – The ask is the price at which an ETF can be bought by an investor, and the bid is the market price at which the same ETF can be sold. The difference between these two is known as the bid/ask spread. The bid/ask spread is a transaction cost similar to brokerage except that the spread is built into the market price and is paid during the purchase and sale. If the spread is large and trading frequency is high, these costs become more relevant. Three factors determine the spread of an ETF:
Volume (turnover) – lower volume means higher spread and vice versa.
Volatility of underlying securities – higher volatility means higher spread and vice versa.
Liquidity of underlying securities – higher liquidity means lower spread and vice versa.

Premium/Discount Volatility
ETFs sometimes trade at a value that is disconnected from their actual net asset value (NAV). When an ETF fetches a market price above NAV, it is said to be trading at a premium, and when it trades below NAV, it is said to be trading at a discount. This however can be a positive factor on overall returns—for example, it might increase your return instead of decreasing it. The price of an ETF reflects multiple factors:
– Current supply and demand for that ETF.
– Fair value of the ETF’s current constituents.
– Costs related to the underlying constituents.

Unlike expense ratios and spreads, a premium or discount is not an explicit cost. In fact, ETF Premiums and discounts do not always result in transaction costs, which makes quantifying them more difficult. The biggest risk arises when an investor buys an ETF at a premium and then sells it at a discount. This is why focusing on the volatility of the premium and discount is more important than looking solely at specific premiums or discounts. The volatility reflects an uncertainty cost, with higher volatility meaning a greater probability that an investor will realize a cost upon selling.

For example, if an ETF trades with a constant 0.4% premium to NAV, and you bought and sold the ETF at that same premium, your return would not be affected. The risk comes when that premium decreases or if the ETF starts trading at a discount during the time you own it. In our example, if you bought the ETF while it was trading at a 0.4% premium but sold it while it was trading at a 0.4% discount, the change during the roundtrip would have cost you 0.8%.

Tracking Error
Tracking error is measured as the standard deviation of excess returns over time, and it indicates how consistently closely (or not) an index ETF follows its benchmark’s performance. This is important because for investors using index products, any doubt about performance adds an uncertainty cost. Depending on an investor’s time horizon, that cost can be even greater than the ETF’s expense ratio or trading spread.

Market Impact Costs
Market Impact Costs is the effect that a market participant has when it buys or sells an asset. It is the extent to which the buying or selling moves the price against the buyer or seller, i.e., upward when buying and downward when selling. As ETFs become more popular and mainstream, the ETF trading increases both in the number of trades and the size of individual trades. This results in an increase in the risk of Market Impact costs.

So now that we have understood the various Explicit and Implicit costs for an ETF – as an Investor we would like to select an ETF which has the least cost across all factors. However, given the type of these costs – we would have realized that some of these are more important than others.

This relative importance of the diverse types of costs factors depends on the holding period and the trade size. A simple 2×2 matrix from Vanguard shows this beautifully:

For retail investors a few things keep in mind:
Expense ratios tend to affect long-term returns most strongly, no matter the trading strategy.
Spreads have the next-largest impact on returns if a trade is small enough to execute within the Average Daily Volume (ADV) on the secondary market. Spreads can be more important than expense ratio if the holding period is short, but as the holding period increases, a lower expense ratio matters more.

In conclusion, investors should remember that key considerations of an ETF’s total cost of ownership include a combination of explicit and implicit costs and it would be prudent to study carefully or consult a professional before trading in the stock market.

References: Vanguard Group Inc., Charles Schwab Corporation and Wikipedia

Perfectly Balanced

Hey there, My Money Box Community! 👋

Remember the sweeping cosmic balance that Thanos sought to achieve in Avengers? Well, guess what — such a balanced act isn’t merely reserved for characters with intergalactic gauntlets! The magic of perfect equilibrium extends right to your personal finance realm, specifically in Asset allocation.

Fear not, this financial sorcery doesn’t demand alien power, but a simple understanding of balancing your investments for long-term prosperity and achieving your goals.

The Art of Asset Allocation: 

I like to equate asset allocation to a smoothie blend. You wouldn’t make a smoothie with just kale, would you? You’d probably add bananas for a dash of sweetness, berries for antioxidants, maybe protein for substance. Similarly, your investment portfolio calls for a strategic blend of diverse investment elements – stocks, bonds, cash, and alternative assets – all aimed at mirroring your distinct risk tolerance and financial ambitions.

Why Asset Allocation is Your Superpower: 

Imagine a rollercoaster ride. Endless descents aren’t fun, are they? Asset allocation strives to make your financial journey less of a white-knuckle ride and more of a controlled cruise. Having a diversified mix of asset classes cushions market-tumbles, where downward trajectories are balanced out by rising elements.

Crafting Your Perfect Blend: 

No magic formula exists here. Your bespoke asset allocation hinges on:

• Your Age: Typically, youthful investors can weather more risk, thus leaning more towards stocks. As you age, bonds could provide income and stability.

• Risk Comfort: Are you the daring cliff-diver or the careful driver? Acknowledging your risk tolerance aids in determining your investment blend.

• Financial Aims: Saving for a leisurely retirement, your first home, or short-term requirements? Different goals necessitate varying risk factors influencing asset allocation.

The Power of the Gauntlet: 

Asset allocation isn’t a once-off affair, instead, it asks for regular rebalancing aligned with life changes, market variations, and evolving financial targets.

In the end, financial serenity isn’t about snapping infinity stones. It’s about thoughtful planning, tweaking, and creating a blend tailored to your unique financial universe. So, summon your inner Thanos, wield your asset allocation gauntlet (or Spreadsheet!!!), and commence the journey toward a “perfectly” balanced financial future. 

Investor Returns vs Market Returns 

DALBAR, Inc.‘s 2021 investor behavior study 📊 painted a very sad but vivid picture 🖼️ of the equity fund investor’s journey over the last two decades. Despite the S&P 500 (a trusted barometer of the U.S stock market) enjoying an annualized return of 7.43%, the average equity fund investor 🕴️ only saw a return of 5.96%. This 1.5% gap 📉 might appear trivial at first glance, but over a span of 20 years, it morphs into a significant financial gap that separates your current financial status 👛 from your potential one 💰.

So, the question – what’s fueling this underperformance?

Imagine a stampede 🐃, where everyone is in a frenzy, taking the cue from their neighbors – panicking when a volatile market is afoot 👣or eagerly jumping aboard when a stock or mutual fund 💹 is having its moment in the sun. These investors are often stricken with a severe case of FOMO (fear of missing out) 😱, which fuels their decisions, taking them further away from their financial objectives.

Some investors fancy themselves as fortune tellers 🔮, with a knack for predicting a market’s upswing and downturn. However, these self-professed fortune tellers are often left nursing their losses while the market moves onwards. It’s not just fear, it’s also greed 💸, impatience 😤, and other emotions that misguide these investors in their strategic investment journey.

The renowned investment research firm, Morningstar⭐, in their “Mind the Gap” report, also highlighted this financial misfortune. Their diagnosis? Investors’ ill-advised decisions to tactically bob and weave through the market, rather than strategically holding their ground. Their recklessness in buying and selling fund shares at the wrong time cost them almost a sixth of their returns they could have earned simply by exercising patience 😌 and pursuing a buy-and-hold strategy.

Share your thoughts, experiences, insights, or even a simple takeaway from this post in the comments below. Looking forward to hearing from you all! 💭🗯️💡

Breaking Free from Home Country Bias: Diversify Your Investment for a Resilient Future

In a world heavily impacted by local economies, it’s crucial to assess the interplay between our human and financial capital. By investing solely in our home country, we risk amplifying the impact of economic downturns on both fronts. Diversification offers a compelling solution, reducing exposure to domestic markets and increasing resilience in the face of adversity.

A few months back, I was approached with an intriguing investment opportunity in an upcoming Indian Shoe Company. It was a unique “structured product” that blended elements of debt and equity. Curiosity piqued, I decided to dig deeper before committing my hard-earned capital. What followed was an enlightening journey that made me question my own biases and shed light on the concept of familiarity bias in investing.

Continue reading “Breaking Free from Home Country Bias: Diversify Your Investment for a Resilient Future”

Sequence of Returns

Sequence of Returns Risk – What does it mean during Retirement

As per a CRISIL report the average return on a diversified equity investment has been around 18% since 1997. However, all of us know that averages are very misleading and are impacted significantly by outliers. And we all have heard of the story of a 6ft tall person drowning in a river of average depth of 5ft – as in some places the depth of the river could be 2ft and at other places significantly more than 6ft and still the average could be 5ft. Similarly, in markets (in general) the returns are volatile – sometimes the returns are significantly higher than the average and at many others lower (even negative) than the average. This is what drives our Portfolio Value and its volatility.

Continue reading “Sequence of Returns”