
As per a CRISIL report the average return on a diversified equity investment has been around 18% since 1997. However, all of us know that averages are very misleading and are impacted significantly by outliers. And we all have heard of the story of a 6ft tall person drowning in a river of average depth of 5ft – as in some places the depth of the river could be 2ft and at other places significantly more than 6ft and still the average could be 5ft. Similarly, in markets (in general) the returns are volatile – sometimes the returns are significantly higher than the average and at many others lower (even negative) than the average. This is what drives our Portfolio Value and its volatility.
However, it is just not important to understand the dispersion of returns around the average for personal financial planning, but it is also key to understand in what the “sequence” these returns were effected on the portfolio.
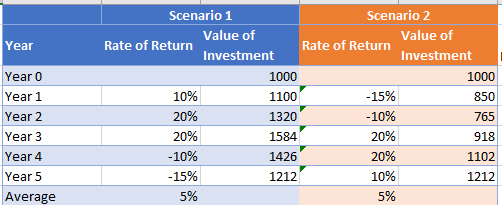
For a quick depiction – see the table below: In Scenario 1 a random sequence of returns is chosen with an average of rate of return of 5% and in Scenario 2 an exact reverse is taken (the average will remain the same 🙂). For these 2 scenarios, INR 1,000 invested in Year 1 grows to INR 1,212 over 5 years. The path traversed by the investment is different, but the final value is the same i.e. this is irrespective of the sequence of the returns.
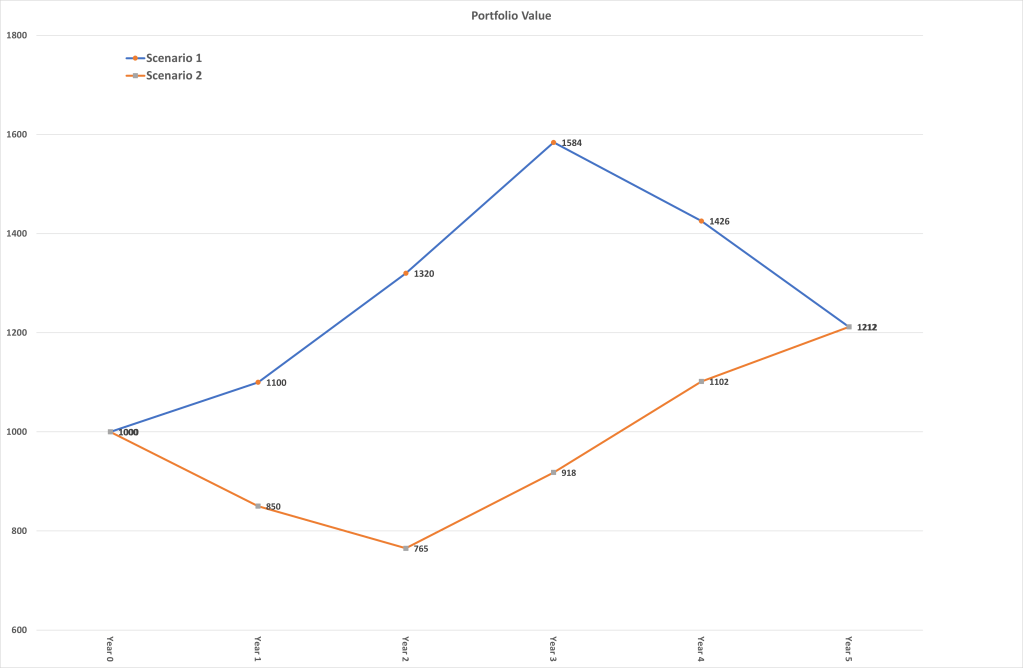
So, it seems from the above table and graph that for Buy & Hold investors the sequence of returns does not matter i.e. when there are no cash inflows or outflows from a portfolio…it does not matter what the sequence of the returns are during this time period. So what is the significance of Sequence of Returns to Personal Financial Planning?
Sequence of Returns comes into play when there are cash flows in or out from the portfolio. What was shown above is not how we manage a portfolio in real life, during the accumulation phase as there are regular inflows and post-retirement phase there are regular withdrawals. These are the real-life situations where the Sequence of Returns becomes significant.
Let’s reuse the same 5 random returns that we took earlier in the post with an average of 5% returns but now apply these to a retiree who is looking at 5 years of such returns. See how the Portfolio behaves with these 2 scenarios of returns with an average of 5% return. For the purposes of this calculation, we have assumed a starting portfolio of INR 1,00,000 and annual withdrawals of INR 10,000.
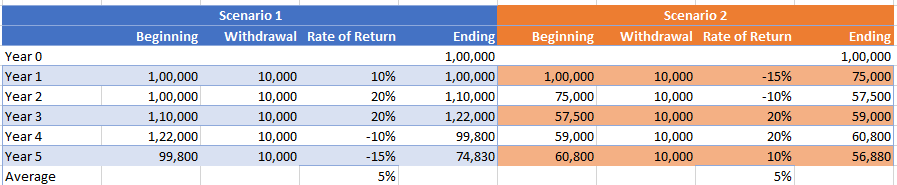
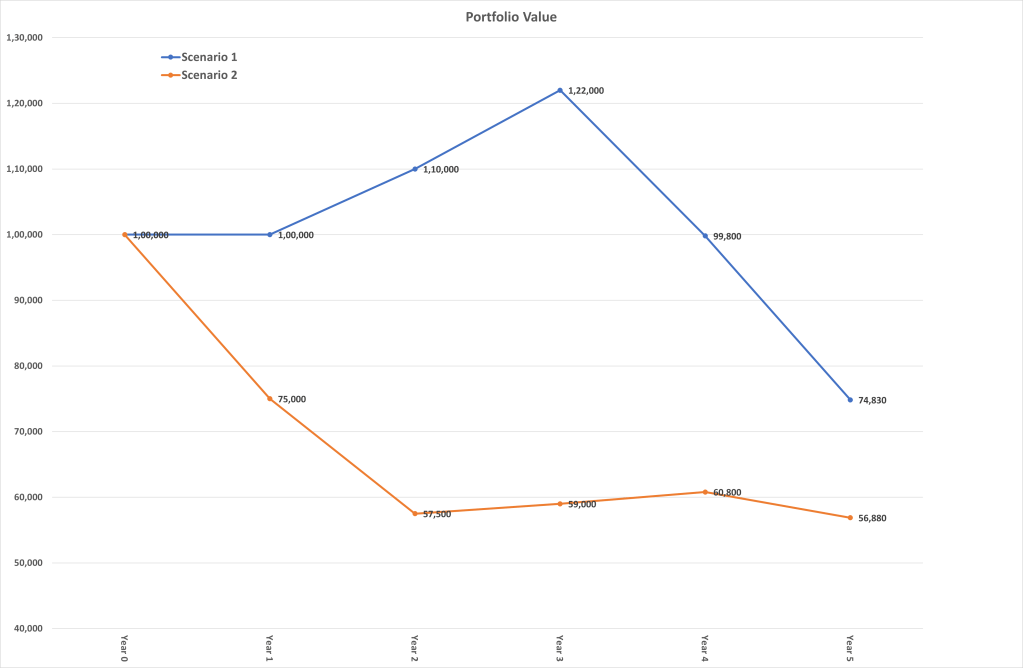
Unlike in the earlier table and graph where despite different paths both the scenarios resulted in the same portfolio value, here due to periodic withdrawals and sequence of returns, the portfolio end values are significantly different (in these scenarios almost 30% difference).
This happens because in scenario 2 as the retiree liquidates part of the portfolio as it’s losing value, so he will have to sell more investments to raise a set amount of cash. Not only does that drain the portfolio more quickly, but it also leaves him with fewer assets that can generate growth and returns during potential future recoveries. For example, in Scenario 2 while the market rebounds in Year 4 and 5 with 20% and 10% return respectively – the retiree’s portfolio is reduced to INR 59,000 and hence the retiree is unable to fully benefit from this recovery.
While hypothetical in nature, these scenarios clearly highlight the risk that Sequence of Returns can have on the Portfolio of a retiree. It is important to understand and mitigate this risk to as much extent as possible in Personal Financial Planning.
In a subsequent post, I will cover some strategies to mitigate this risk of Sequence of Returns.
Do leave your comments, questions and share your experiences in the section below. If you would like to be informed when the next post comes out, please subscribe to the blog via email.
Hope all you have a wonderful 2023.
